DATA VISUALIZATION AND REPORTING SERVICES
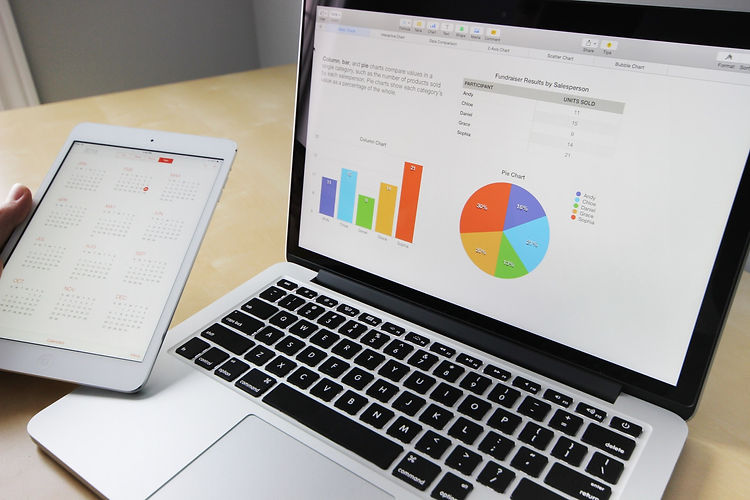
Spot trends, track goals, compare performance of various categories, brands and products with a strong visualization platform designed to fit your business needs.


Absorb large complex data instantly
More data driven decision making
Better audience engagement
Uncover hidden pattern and deeper insight
Identify areas that need attention immediately
WHY A PICTURE IS WORTH A THOUSAND WORDS.
BI Implementation
By establishing connections with different data sources, we curate comprehensive visualizations. This helps you slice and dice data with ease and arrive at relevant conclusions to drive growth and profitability
BI Visualization & Reports
We develop leadership, strategic, and operational reports and dashboards
BI Integration
We bring together data from disparate sources, renders the data to derive hidden insights.
Self-Service BI
Design portals and interfaces for non-technical users, allowing them to search, explore and use governed data assets without IT Support.
